How to use analytics to choose restaurant sites.
By Greg Goddard
Choosing a good location is one of the most important decisions a restaurant operator makes in the development process and has a lasting impact on the performance of the restaurant. While most restaurant operators know to look for things like good ingress/egress and visibility, there are many equally important factors that are not as easy to identify and measure.
Predictive analytics software allows restaurants to look at hundreds or even thousands of data points to rate a potential site. This provides much higher clarity on a site’s earning potential and increases the restaurant’s chance for success.
Choosing an Analytics Provider
As with any vendor, restaurants should find an analytics company that fits with its brand. There are two main options when choosing a site analytics provider: custom or off-the-shelf. Off-the-shelf analytics uses a general, predetermined formula to rate potential sites. Custom analytics is built specific to each restaurant chain to provide a formula unique to that brand. This is best for brands with a unique concept, but it is more expensive and takes more time to implement. To create a successful formula, restaurant chains must have at least 32 locations to generate the data needed to model against.
To build custom analytics software, the restaurant chain provides the analytics company its entire data set, including location information such as opening date, remodel date, parking, number of seats, square footage; at least a few years of sales history; and latitude and longitude for each restaurant, which allows the analytics company to build a web crawler to find when competitors and traffic generators opened. Then, the software will look at how each of those factors affected sales to determine what is statistically significant about the chain’s top 25% of stores.
 Initial setup of custom analytics requires input from many executive team members. Operations should provide input about other factors that could affect restaurant performance to take the subjectivity out of the process. For example, if a restaurant in a location with historically strong socio-demographics has suffered from poor operations for years, the operations need to be considered as a factor as to why the store is not performing to its potential. Additionally, the chain should give the analytics company an idea of what its competitors and key traffic generators are and why. Remember, competitors aren’t solely similar type concepts, but also concepts that generate a similar ticket average in the category (e.g., QSR).
A critical step of modeling is to create clusters to ensure you’re measuring a similar type store. For example, urban restaurants are different than rural or suburban locations, and as such, require a different formula. As restaurant concepts expand, they will need to refresh clusters, and they will run into new competitors and traffic generators in different regions; this should be included in the contract with the analytics provider. Each unique variable can impact performance, so custom analytics software should be updated every year.
How Analytics Works
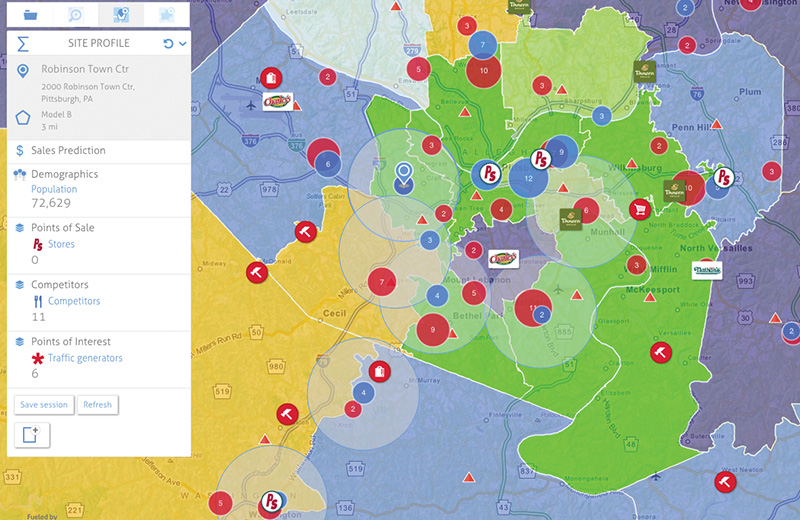
Without using site analytics, most restaurant chains evaluate a potential site on a dozen or so factors. Site analytics uses more than 4,000 variables in ways that restaurant operators or tenant reps can’t do on their own.
• Population: Most restaurant chains believe an average population metric is enough to vet the strength of the location. Site analytics takes that number and looks at it from the perspective of each individual person. The software can measure the surrounding population by gender, race, income, education and more. Instead of focusing on 50,000 people in the aggregate, analytics looks at each person individually and models that against the top performing stores of the cluster. Analytics will provide clarity on what the male-to-female ratio, average income, etc. should be for success.
• Competition: Each restaurant concept will do better next to certain competitors and traffic generators; this is proven analytically. Some restaurants may do better next to Whole Foods Market or Trader Joe’s while others get more visits from Kroger or Publix. A restaurant chain might do well next to Chipotle, but it still has to consider each market individually. If Chipotle is adding “fill-in” stores in their tertiary round of development, and a restaurant is just entering that market for the first time, that concept can’t just follow Chipotle’s locations to find success.
Custom analytics software gives a sales prediction for each potential location. If that number is above the required threshold, the company should continue with due diligence. It is very important to understand that analytics is only a piece of the puzzle and should be used in conjunction with traditional site evaluation methods. After analytics identifies a potential site as a good location, brands should still go to the site to physically check the location for visibility, ingress/egress, signage, co-tenancy, parking and other things that aren’t shown on a computer screen.
Analytics can also be used to determine market potential. Markets can be mapped via analytics to identify the best trade areas. Custom analytics can hyper-localize this down to the intersection. This provides direction and clarity to the tenant rep and allows franchisees and restaurant operators to open the first stores in a market in the best areas. It’s important to still use site analytics to choose the specific sites, though. A good site in a lower scoring area could do better than a bad site in a higher scoring area.
 Conclusion
Although expensive, analytics is a great tool for site selection, but it should not be the end all, be all. Different chains will have different results and levels of success, which is largely predicated on the amount and quality of data and the application of the model throughout the system. For example, if a restaurant delivers, it has access to consumer addresses. That is invaluable data that brands that don’t offer delivery don’t have.
Some restaurant executives may be scared by software analytics, but it does not require a statistician to interpret the results. Each restaurant chain should have a champion of the software who believes in the software and can explain how or why it works to franchisees. This is especially important if the analytics turns down a potential location a franchisee found.
Since using custom analytics software for site selection, Penn Station’s new restaurant locations are opening at a 20% higher volume than the previous 5 years. As an established brand, it took awhile to refill the development pipeline with analytically supported sites, but franchises are in better position for success. Analytics software provides direction and clarity to the development team, tenant reps, franchisees and, most importantly, helps to ensure franchisees get the best return on investment and mitigates the risk of failures.
— Greg Goddard is director of development for Cincinnati-based Penn Station East Coast Subs, a fast-casual franchise with more than 300 locations in 15 states. For more information, visit www.penn-station.com.